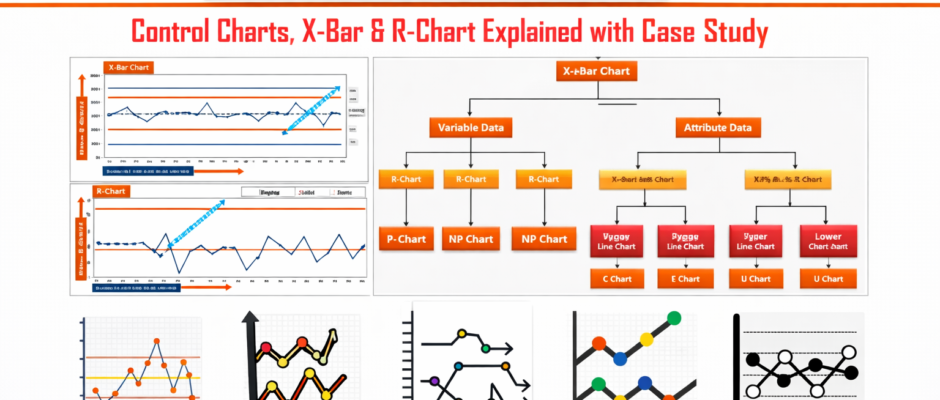
What is a Control Chart?
Monitors Process Behavior Over TimeIt helps track process data in sequence to understand trends and stability. Distinguishes Between Normal and Abnormal VariationIt identifies the difference between common cause variation (natural process variation) and special cause variation (due to specific problems). Helps Maintain Process ControlIt allows teams to detect process instability early and take corrective actions. […]