
Monitors Process Behavior Over Time
It helps track process data in sequence to understand trends and stability.Distinguishes Between Normal and Abnormal Variation
It identifies the difference between common cause variation (natural process variation) and special cause variation (due to specific problems).Helps Maintain Process Control
It allows teams to detect process instability early and take corrective actions.One of the Essential 7 QC Tools
Control charts are considered one of the most powerful tools for process monitoring and continuous improvement.Widely Used in Lean Six Sigma and Quality Management Systems
It is commonly applied in Lean Six Sigma projects and standards such as ISO 9001 and IATF 16949 to ensure consistent quality
Definition of a Control Chart
Situations Where Control Charts Should Be Applied
Reasons for Using a Control Chart
Practical Uses of Control Charts
Origin and Evolution of Control Charts
Essential Parts of a Control Chart
Concept of Process Variation
Variation Caused by Common Factors
Variation Caused by Assignable Factors
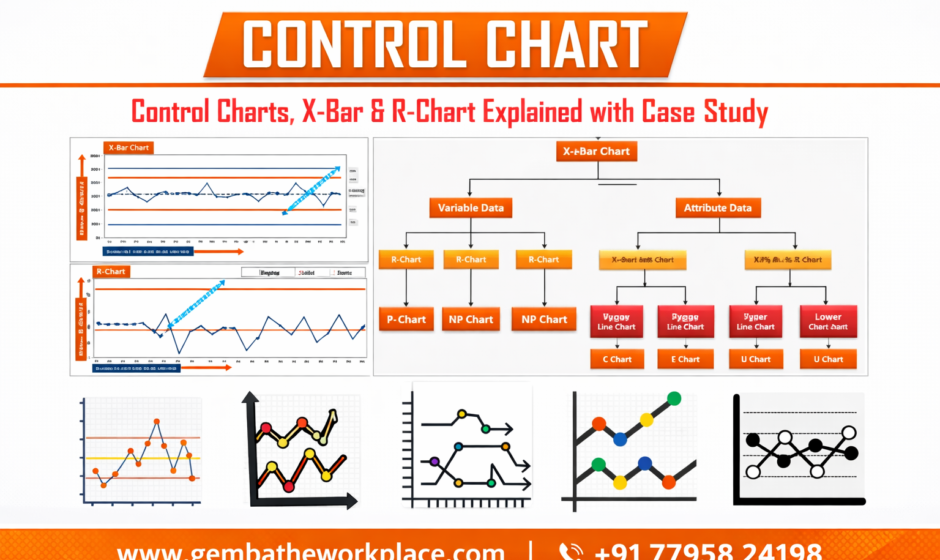
Different Categories of Control Charts
Sample Illustration of a Control Chart
Procedure to Develop a Control Chart
Guidelines for Reading and Understanding Control Charts
Connection Between Process Stability and Process Capability
Meaning of Process Stability
Meaning of Process Capability
Strengths of Control Charts
Drawbacks of Control Charts
Value and Importance of Control Charts
Final Summary
Use a control chart when you need to monitor a process continuously to ensure it remains stable over time.
It is applied when collecting measurement or inspection data at regular intervals.
Control charts are useful during production to detect process shifts or unusual variation early.
They are used after process changes, maintenance, or new product launches to verify process stability.
Control charts are essential in Lean Six Sigma and quality systems to maintain consistent process performance.
Reasons for Using a Control Chart
It helps identify whether a process is operating under controlled and stable conditions.
It enables early detection of abnormal variation before defects occur.
Control charts support data-based decision making instead of relying on assumptions.
They help reduce defects, rework, and process inefficiencies.
Control charts are widely used to maintain consistent quality and meet industry standards.
Practical Uses of Control Charts
Control charts are used to monitor manufacturing and production processes over time.
They help detect process variation and identify potential quality issues early.
They are applied to track critical parameters such as dimensions, weight, or temperature.
Control charts support continuous improvement and process optimization activities.
They are commonly used in quality management systems and Lean Six Sigma projects.
Origin and Evolution of Control Charts
Control charts were developed in the 1920s by Dr. Walter A. Shewhart to improve manufacturing quality.
They were first used in the Bell Telephone Laboratories to control production processes.
The method became widely adopted during World War II to ensure reliable manufacturing.
Control charts later became a key part of Statistical Process Control (SPC).
Today, they are used globally in industries to maintain process stability and product quality.
Essential Parts of a Control Chart
Center Line (CL): Represents the average or mean value of the process data.
Upper Control Limit (UCL): Indicates the maximum acceptable limit of normal process variation.
Lower Control Limit (LCL): Indicates the minimum acceptable limit of normal process variation.
Data Points: Individual measurements plotted over time to monitor process performance.
Control Limits: Boundaries that help determine whether the process is stable or requires investigation.
Concept of Process Variation
Every process shows variation due to differences in materials, machines, methods, or environment.
Understanding variation helps determine whether a process is stable or unstable.
Variation can be analyzed using statistical tools such as control charts.
Identifying the source of variation helps prevent defects and improve quality.
Managing variation is essential to maintain consistent process performance.
Variation Caused by Common Factors
Common cause variation is the natural and expected fluctuation present in any stable process.
It occurs due to normal factors such as machine capability, material properties, and environmental conditions.
This type of variation affects all outputs of the process consistently over time.
It does not indicate a specific problem but reflects the inherent limitations of the process.
Reducing common cause variation requires overall process improvement and system changes.
Variation Caused by Assignable Factors
Special cause variation occurs due to specific and identifiable factors outside normal process conditions.
It may result from equipment malfunction, incorrect settings, operator error, or material issues.
This variation is usually irregular and not part of the normal process pattern.
Control charts help detect special cause variation when data points fall outside control limits or show unusual trends.
Identifying and eliminating special causes helps restore process stability and prevent defects.