

In any manufacturing or service organization, quality problems cannot be solved effectively without data-based analysis. The 7 Basic Tools of Quality provide a simple and structured approach to collect data, analyze problems, identify root causes, and control processes.
These tools are powerful yet easy to use. Studies show that up to 90% of workplace quality problems can be solved using these seven tools alone. 7 Tools of QC [Compatibility Mo…
They form the foundation of:
- IATF 16949 and ISO 9001 quality systems
- Root cause analysis and corrective actions
- Continuous improvement and Lean implementation
- Process monitoring and control
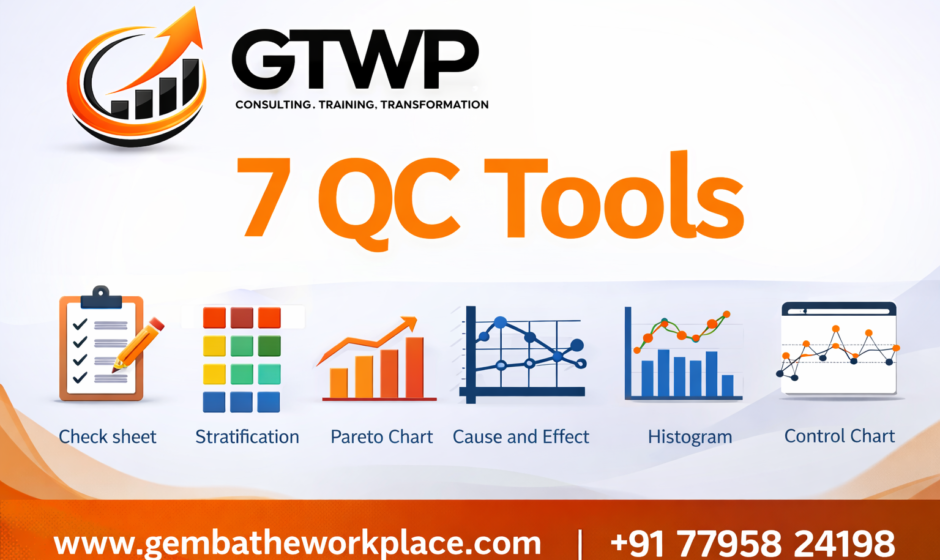
The 7 Basic Tools of Quality
According to quality management principles, the seven tools include:
- Check Sheet
- Stratification
- Pareto Chart
- Cause and Effect Diagram
- Histogram
- Scatter Diagram
- Control Chart 7 Tools of QC [Compatibility Mo…
Each tool serves a specific purpose in problem solving.
1. Check Sheet – Collecting Data Systematically
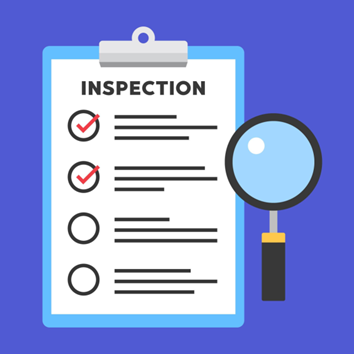
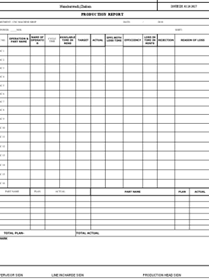
A check sheet is a structured form used to collect and record data in a simple and organized manner. It helps teams gather facts directly from the process. 7 Tools of QC [Compatibility Mo…
Purpose
- Collect defect data
- Record process performance
- Identify defect frequency
Example
Tracking defects such as:
- Scratch
- Dent
- Dimension out of specification
Benefits
- Easy data collection
- Supports fact-based decision making
- Provides input for Pareto and other tools
2. Stratification – Separating Data to Find Patterns
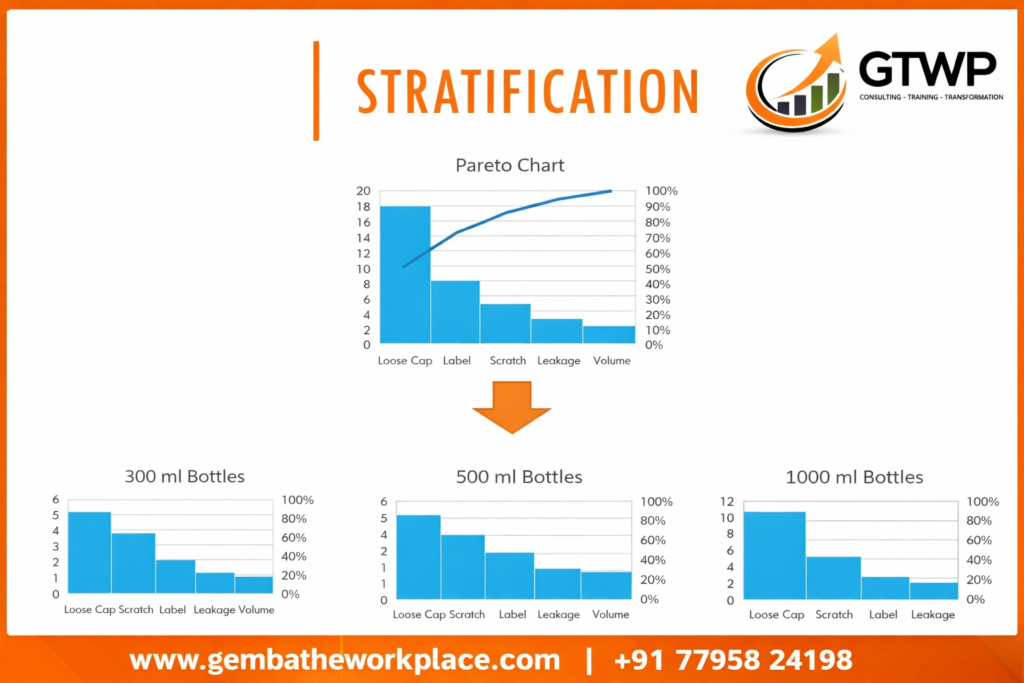

Stratification means dividing data into groups to identify patterns and sources of variation. 7 Tools of QC [Compatibility Mo…
Data can be separated by:
- Machine
- Shift
- Operator
- Material batch
- Supplier
Example
Instead of total rejection data, analyze rejection by shift. This may reveal that defects occur mainly during one shift.
3. Pareto Chart – Identifying the Most Important Problems

A Pareto chart shows problems in order of frequency, helping identify the most significant causes. 7 Tools of QC [Compatibility Mo…
It is based on the 80/20 principle, which states that:
- 80% of problems come from 20% of causes
Benefits
- Helps prioritize improvement efforts
- Focuses on high-impact problems
- Improves resource utilization
4. Cause and Effect Diagram – Identifying Root Causes


Also called the Fishbone Diagram or Ishikawa Diagram, it helps identify possible causes of a problem.
Common categories include:
- Man (People)
- Machine
- Method
- Material
- Measurement
- Environment
Benefits
- Identifies root causes
- Supports structured problem solving
- Improves corrective actions
5. Histogram – Understanding Data Distribution


A histogram is a bar graph showing frequency distribution of measured data. 7 Tools of QC [Compatibility Mo…
It helps understand:
- Process variation
- Process capability
- Data distribution
Example
Distribution of shaft diameter measurements.
6. Scatter Diagram – Understanding Relationships Between Variables
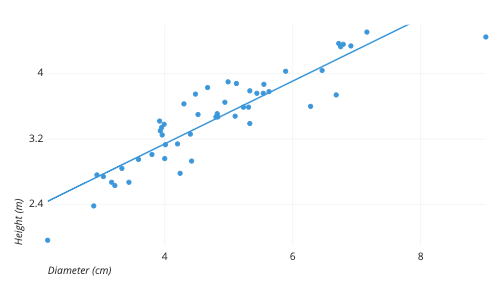

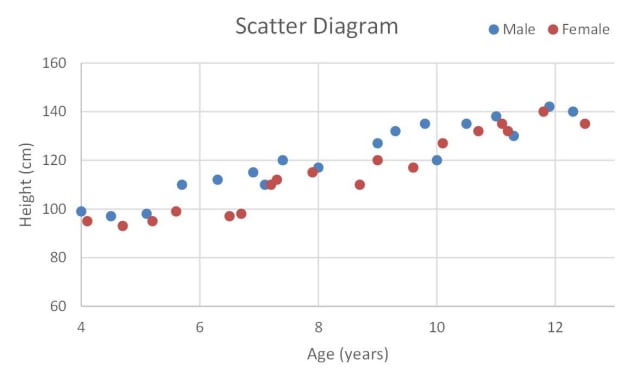
A scatter diagram shows the relationship between two variables.
Example:
- Temperature vs defect rate
- Pressure vs leakage
It helps determine whether one factor influences another.
7. Control Chart – Monitoring Process Stability
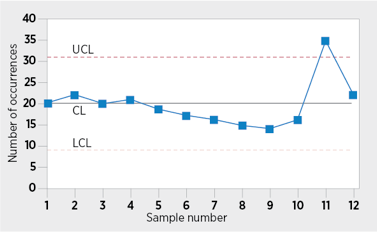

A control chart is used to monitor process performance over time and identify variation.
It helps distinguish between:
- Common cause variation (normal variation)
- Special cause variation (abnormal variation)
Benefits
- Detects process instability
- Prevents defects
- Improves process control
Why the 7 QC Tools are Essential
Organizations implementing these tools achieve:
- Reduced defects
- Improved productivity
- Faster root cause identification
- Improved audit readiness
- Better customer satisfaction
These tools form the foundation of Lean, Six Sigma, and IATF 16949.
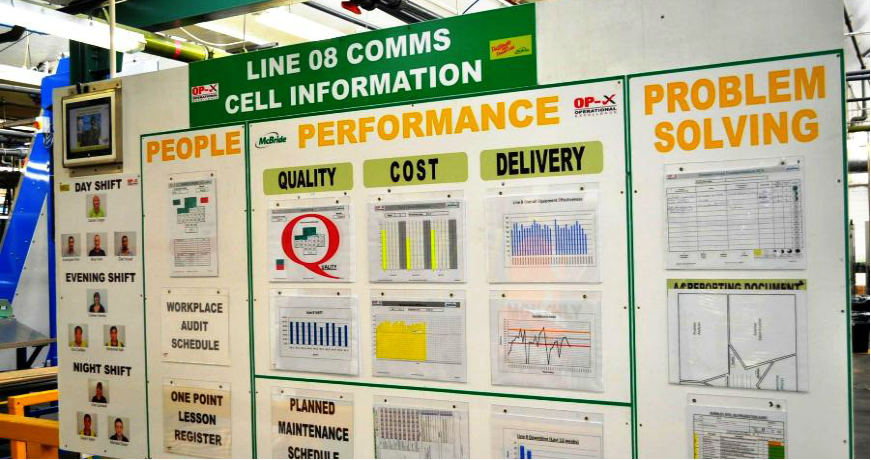
How Gemba The Workplace Supports Your Organization
Gemba The Workplace – Consulting · Training · Transformation
We help organizations implement practical quality tools.
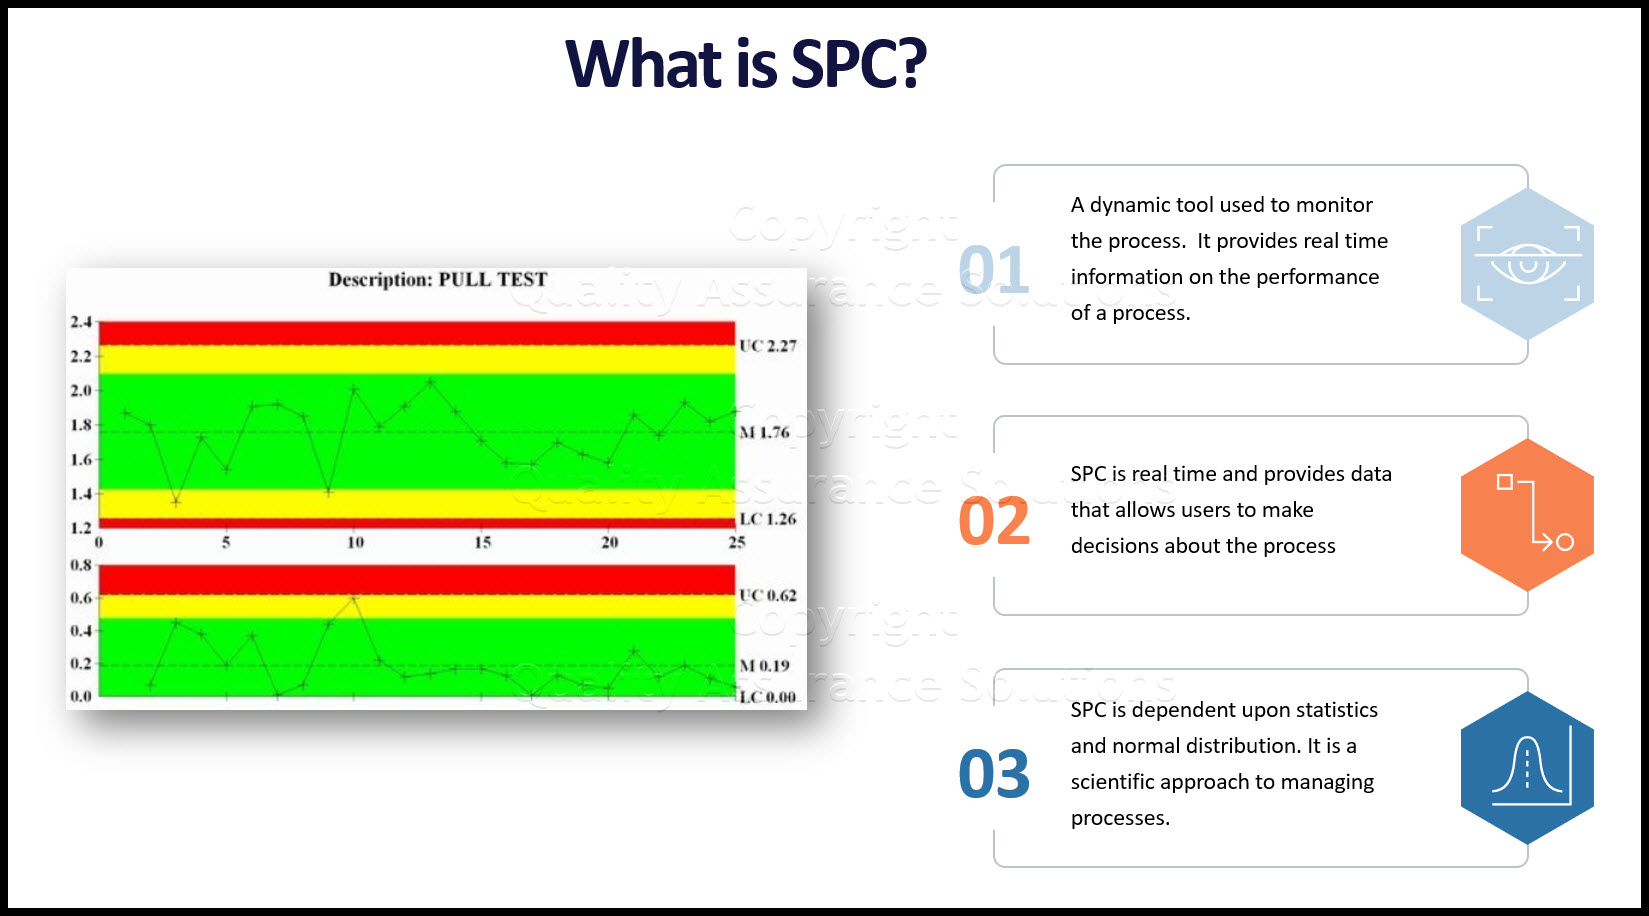
Consulting
- SPC Implementation – manual and Digitization
- Process improvement projects with respect to variation
- Root cause analysis support action using SPC
Training
- 7 QC Tools training
- Internal auditor training
- Core tools training
Transformation
- Shop floor quality improvement
- SPC implementation
- Continuous improvement culture
Contact Gemba The Workplace
Website: https://gembatheworkplace.com
Phone: +91 77958 24198
Email: support@gembatheworkplace.com